Ios内存管理——调试
iOS/OS X 内存管理(二):借助工具解决内存问题讲了一些调试技巧,包括:
- 启用Zombie Object进行悬挂指针的检测。
- 应用Product -> Analysis进行内存泄露的初步检测。
- 应用Leak Instrument进行内存泄露查找。
- 在以上方法不奏效的情况下,通过查看
dealloc是否调用查看某个class是否泄露的问题。
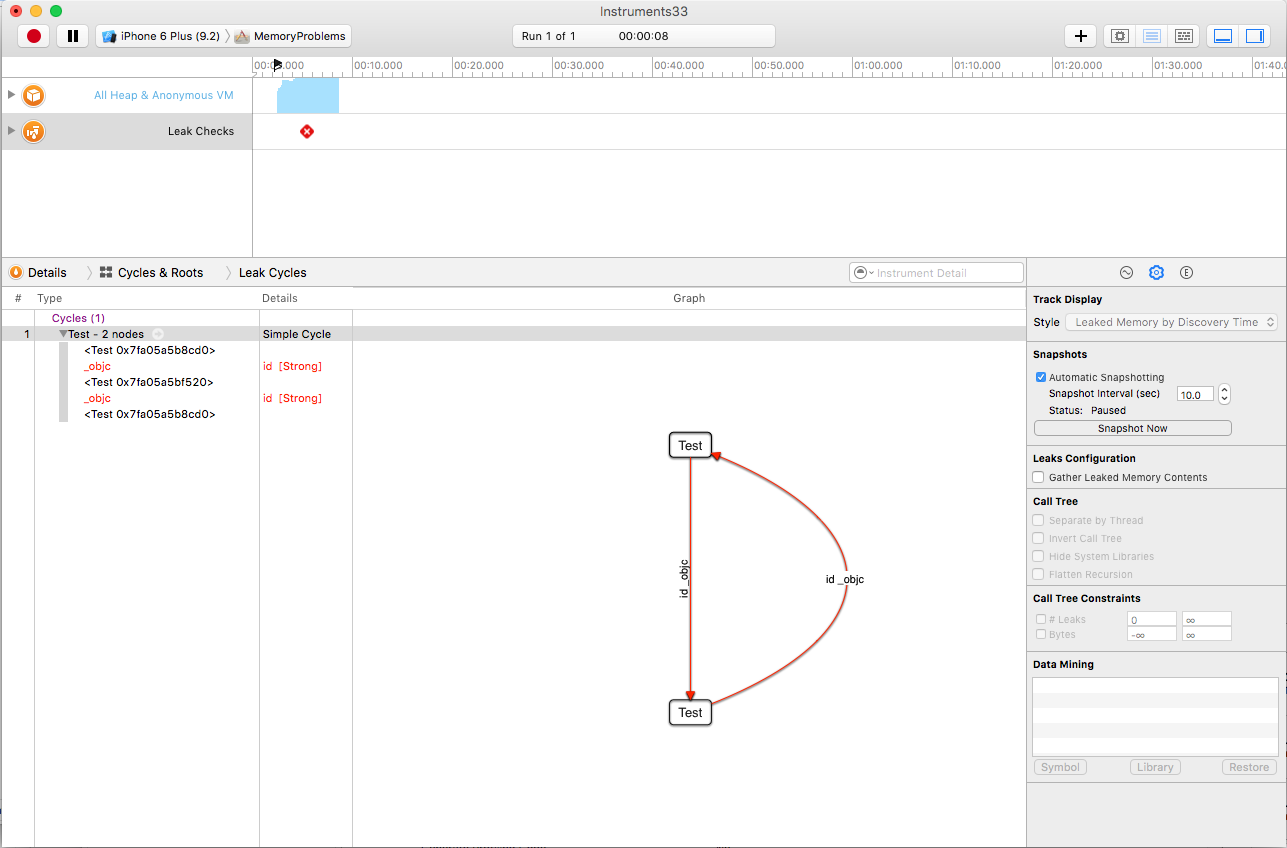
补充一下:在Leak页面可以打开Cycles & Roots用图的方式查看ratain cycle的问题,截图如下:
上文没有介绍的,也是比较麻烦的,就是leak instrument没法查出的内存泄露。最近在调试一个这样的问题,写点心得。
行动前的准备
认识工具
参看Leaks Instrument和Allocation Instrument的官方文档。
补充:
- Leak Instrument有Cycles & Roots界面,见上。
- Persistent Bytes和#Persistent。#Persistent是object的数量,也就是allocation的次数,而Persistent Bytes是具体的内存大小。#Persistent是我们需要关注的,内存有没有泄露也是看这个值是不是只增不减。
- Allocation Instrument进行profile的时候,为Launch Configuration for Heap Allocations勾选Record reference counts。
编译参数设置
为了保证看到代码,而不是一堆无意义的内存地址,参考The .dSYM File in Ios Project进行xcode的设置。
如果dealloc没有被调用
通过Allocation Instrument,我们可以得到内存使用情况。为了清楚地看出是哪部分最可能是内存泄露,可以使用Call Trees视图,然后在右边:
- 勾选Hide System Libraries,排除系统影响。
- 勾选Invert Call Tree,使占用内存最多的分支在最前面。
通过以上方法,可以大概确定是哪部分内存泄露。然后看看该class是不是被dealloc了。
- 如果
dealloc了,那不是本文要解决的问题。 - 如果
dealloc没有调用到,继续往下看。
Retain Cycle导致dealloc没有被调用
在ARC下,dealloc不能被调用,一般是因为存在Retain Cycle,而导致Retain Cycle的情况可能是下面几种可能(参考iOS Retain Cycle in ARC和Dealloc not being called on ARC app):
1. Blocks
并不是所有在block中引用self都会带来retain cycle,比如下面的代码就不会有内存泄露:
1 2 3 4 5 6 7 | |
因为在上面的代码中,block ratain了self,但是self中没有retain这个block。只有当block中引用了self,并且self又以某种方式(比如用一个具有strong属性的Property指向该block,或者将该block加入了self的一个具有strong属性的array中)强引用了该block,才会引起内存泄露,比如:
1 2 3 4 5 6 | |
有时候即使没有直接引用self,也可能导致self被retain,这叫做“implicit retain”。一种可能的情况就是在block中引用了self的实例变量,比如:
1 2 3 4 5 6 7 8 | |
这段code在block中引用了self的实例变量_aCat。
为了避免implicit retain,可以在xcode的build setting中打开implicit retain of ‘self’ within blocks,xcode编译器会给出警告。
2. NSTimer
如果在view controller中创建了NSTimer,在消失view controller的时候需要调用invalidate,否则会产生ratain cycle。
3. Observers/NSNotificationCenter
当我们在NSNotificationCenter的block中引用self的时候,也会产生retain cycle,比如:
1 2 3 4 5 6 | |
在不用的时候需要将self从NSNotificationCenter中移除。
4. Array contained reference
比如在view controller中将self放在了一个array中,而这个array在view controller消失的时候不会被释放,view controller的dealloc就不会被调用。
5. Delegate
delegate的属性应该为weak。
dealloc没被调用的调试
调试dealloc没有被调用的情况,参考Instruments Allocations track alloc and dealloc of objects of user defined classes,可以看到对应实例在整个生命周期中发生的所有和内存有关的事件,包括malloc,ratain,release等和每次事件的call stack。注意其中的两项设置:
- 勾选Record reference counts,记录retain,release和autorelease事件。
- 为Allocation Lifespan选择All Objects Created,如果你想看到已经被dealloc的实例,这个可以不选。
- 在Allocation List -> All Allocations 中可以搜索自己感兴趣的class。
- 在reference count页面,注意使用All、uppair等进行过滤。
关于ARC下的retainCount
在ARC之前,我们可以使用retainCount得到一个Object被retain的次数。
引入ARC之后,这个方法不能在code中使用,可以使用下面的方法获得retain的次数:
1
| |
或者通过设置断点,在调试窗口输入如下命令:
1
| |
我们什么时候使用retainCount?
Never!
参考 When to use -retainCount?。 但是偶尔在调试的时候用一下,对于一些内存管理概念的理解还是有好处的,仅此而已。